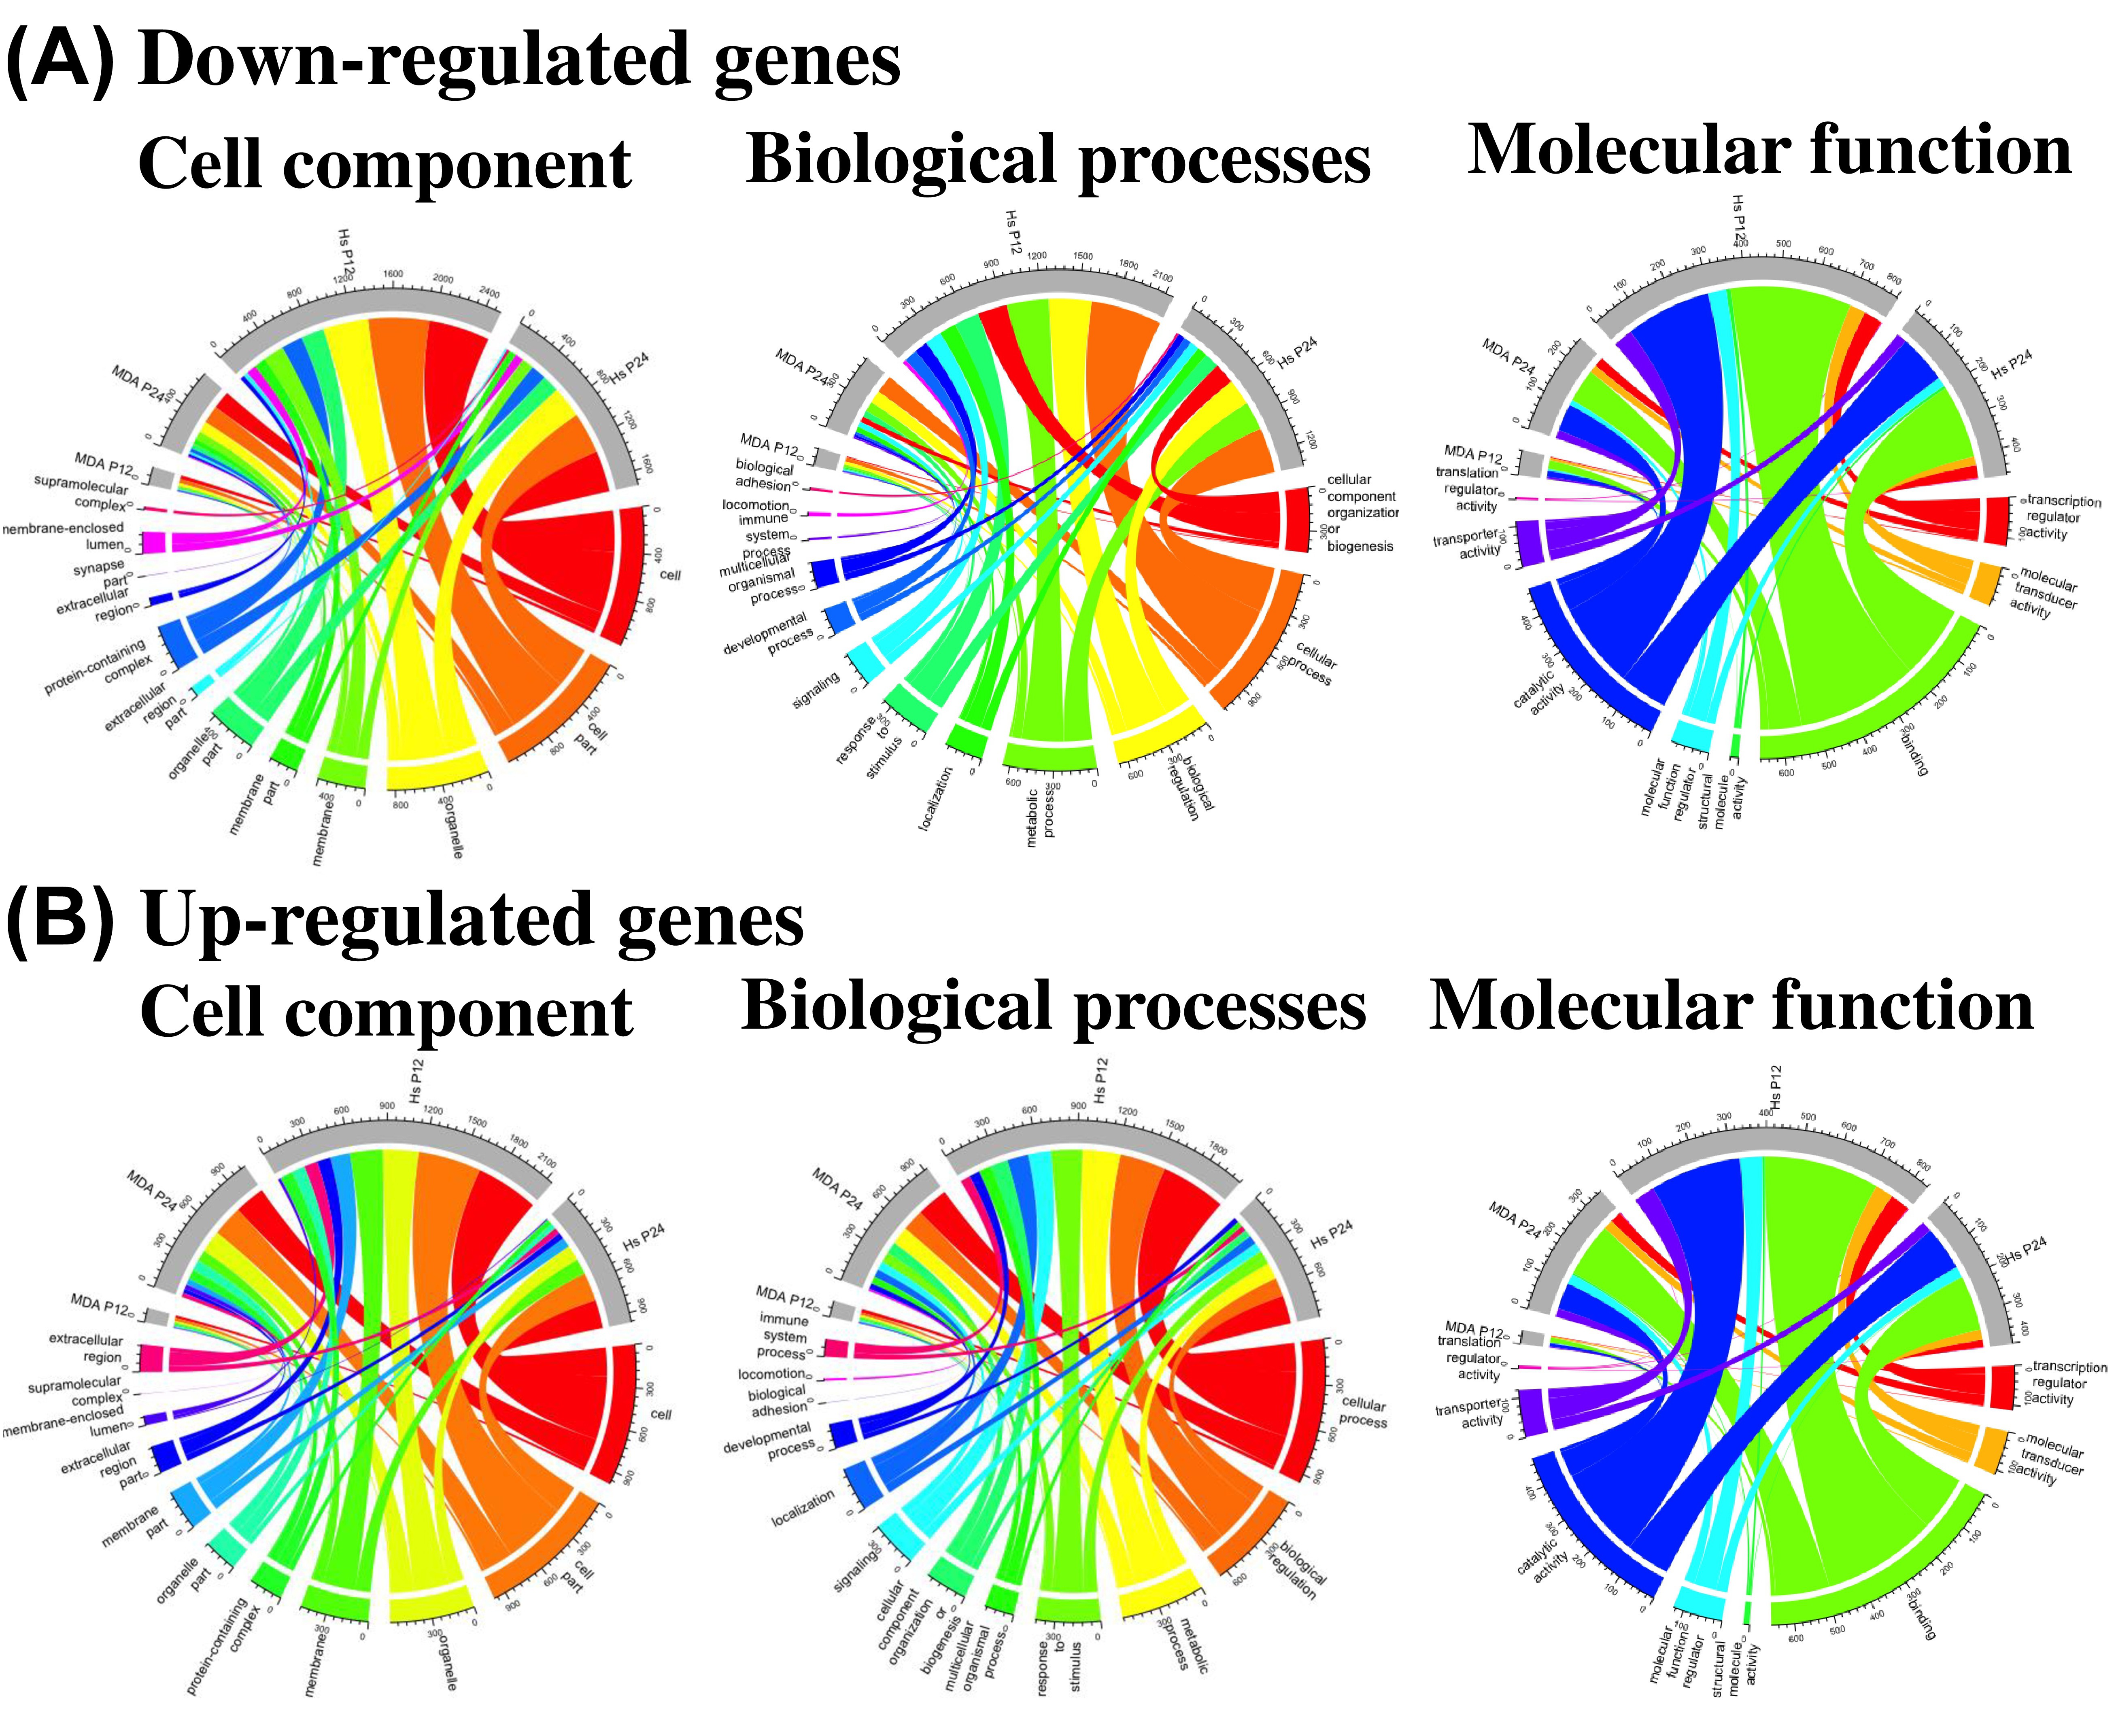
Fig. 7. Circos plot of the Gene Ontology enrichment analysis. Graphical representation of the cell component, biological processes and molecular function for (A) up-regulated genes for Hs578T/Pax and MDA-MB-231/Pax at P12 and P24 and (B) down-regulated genes for Hs578T/Pax and MDA-MB-231/Pax at P12 and P24.